Any discussion of 2020 convenience industry data will be forever intertwined with the new realities brought on by the pandemic. Consumers not only changed how often they shopped but also how they shopped and what they purchased, forcing convenience retailers to pivot to meet expectations, adjust their sales mix and provide safe shopping experiences both in-store and on the forecourt.
Because 2020 was a year like no other, the 2021 NACS State of the Industry Summit, held virtually April 14, was highly anticipated as a guide to explain how the industry fared amid chaos and also to look at what’s next.
Bigger Baskets
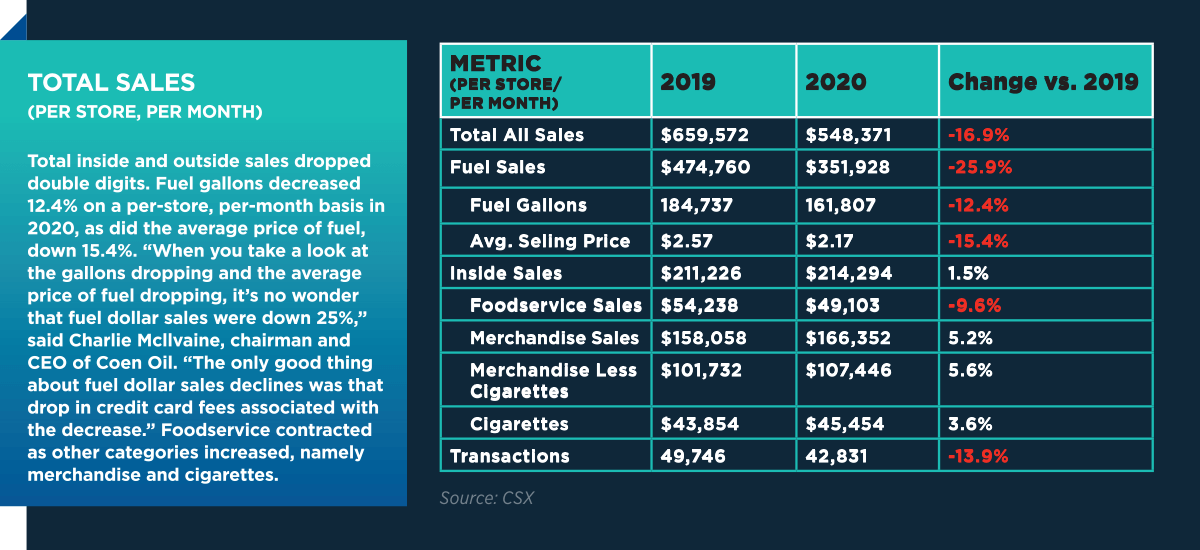
NACS board member Charlie McIlvaine, chairman and CEO of Coen Oil and the 57-store Coen Markets, based in Pennsylvania, shared a first look at the 2020 numbers with SOI Summit attendees. He pointed to a bright spot that emerged among the less-than-stellar 2020 year-end data: Basket sizes increased in the double digits, which in turn helped inside sales reach a new record.
While the transaction count was down, the basket sizes were up sharply.
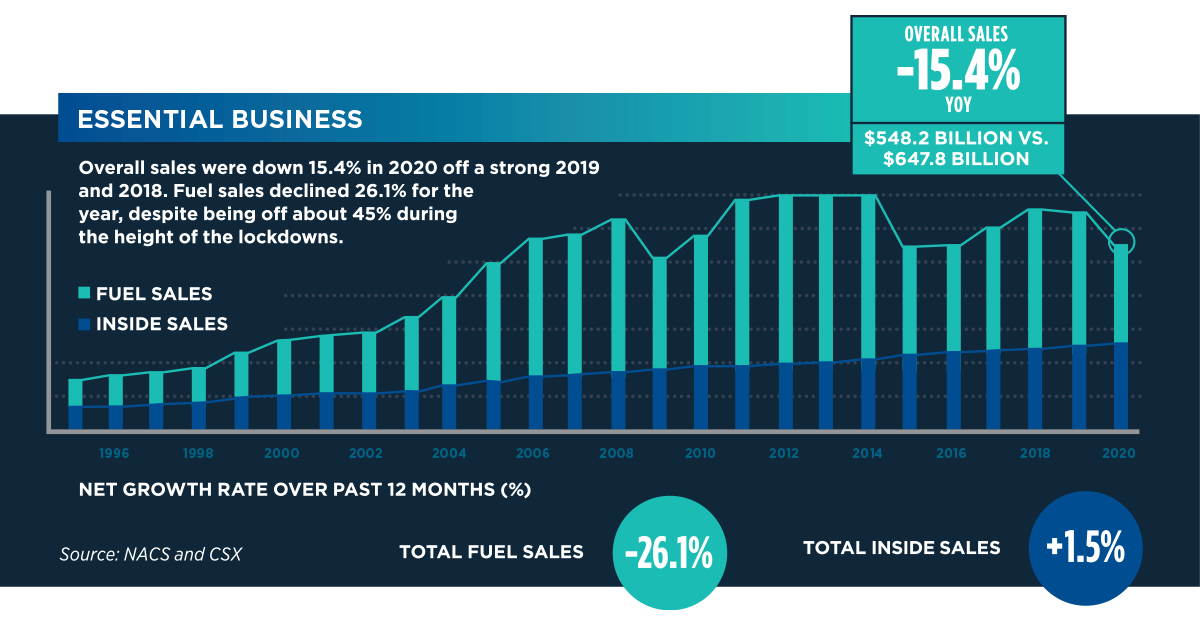
It wasn’t enough, however, to offset the larger double-digit decline in overall industry sales. Total U.S. convenience store sales dropped 15.4% in 2020, ending the year at $548.2 billion. The drop follows a strong 2018 and 2019, when total sales were $654.3 billion and $647.8 billion, respectively.
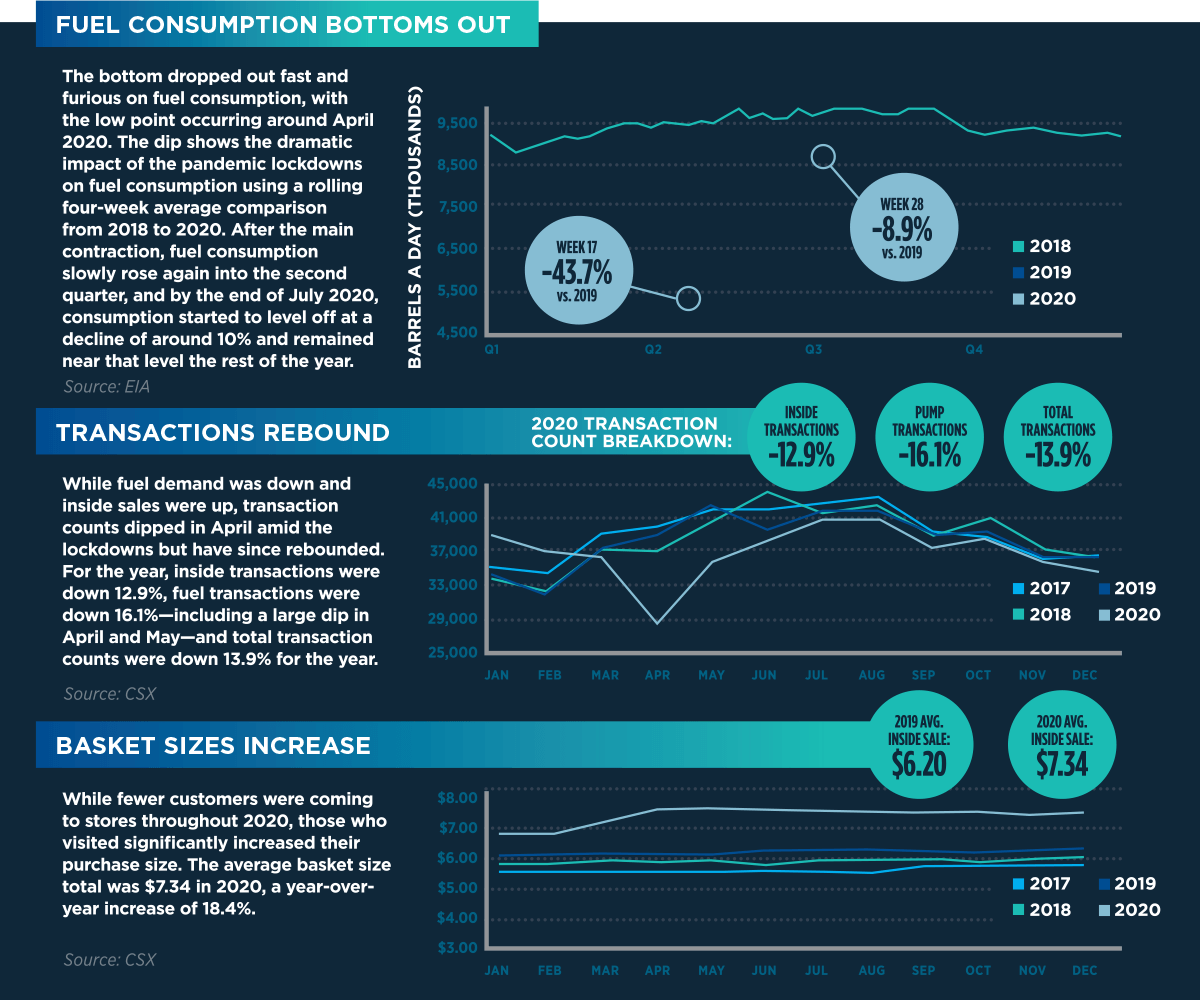
Convenience stores sell about 80% of the fuel purchased in the United States. In the heat of the pandemic, fuel sales saw historic declines, with fuel consumption contracting about -45% at the lowest point, according to NACS SOI data. Total industry fuel sales declined 26.1% in 2020 to $292.6 billion, compared with $395.9 billion in 2019. Fuel sales started to slowly rebound in the second quarter. Clearly, workplace changes weighed in here, McIlvaine said. “Despite this significant dislocation from work, Americans were still moving around in the last half of the year,” he noted.
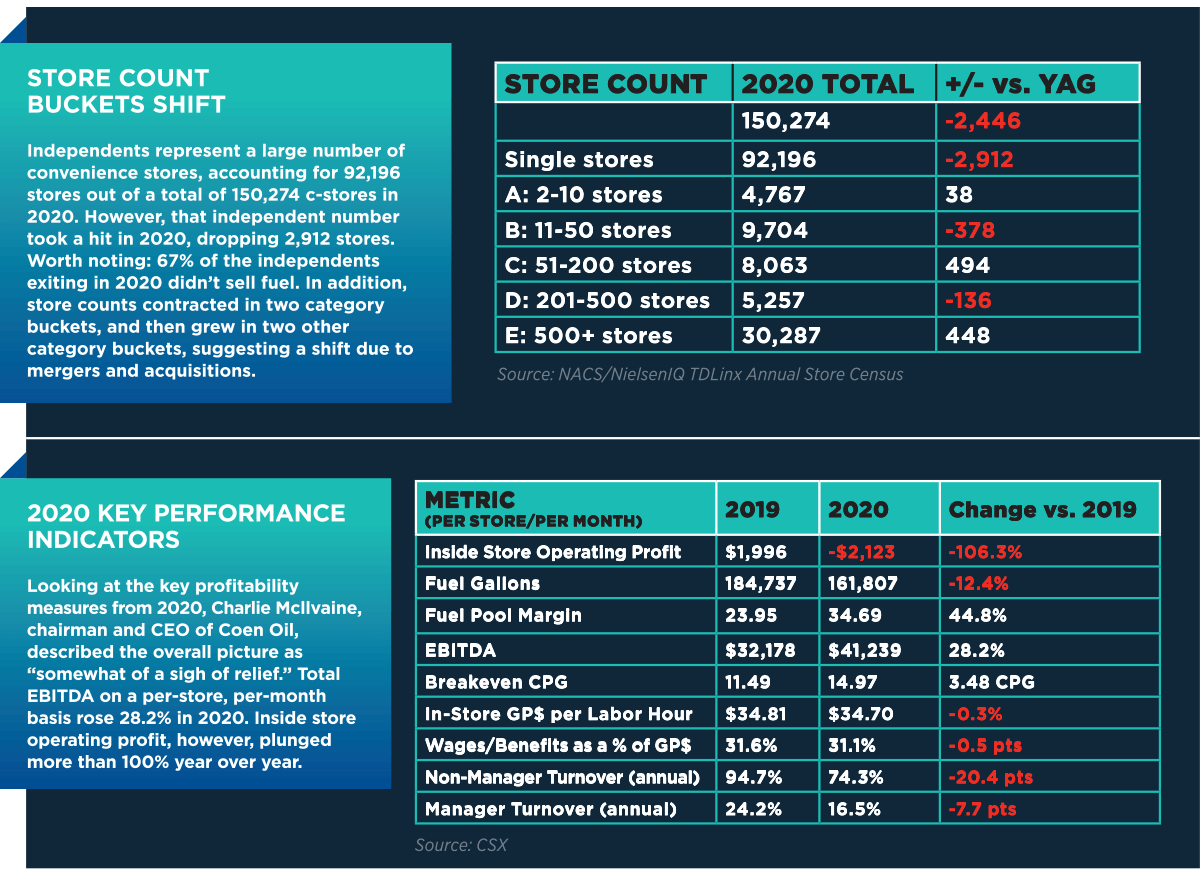
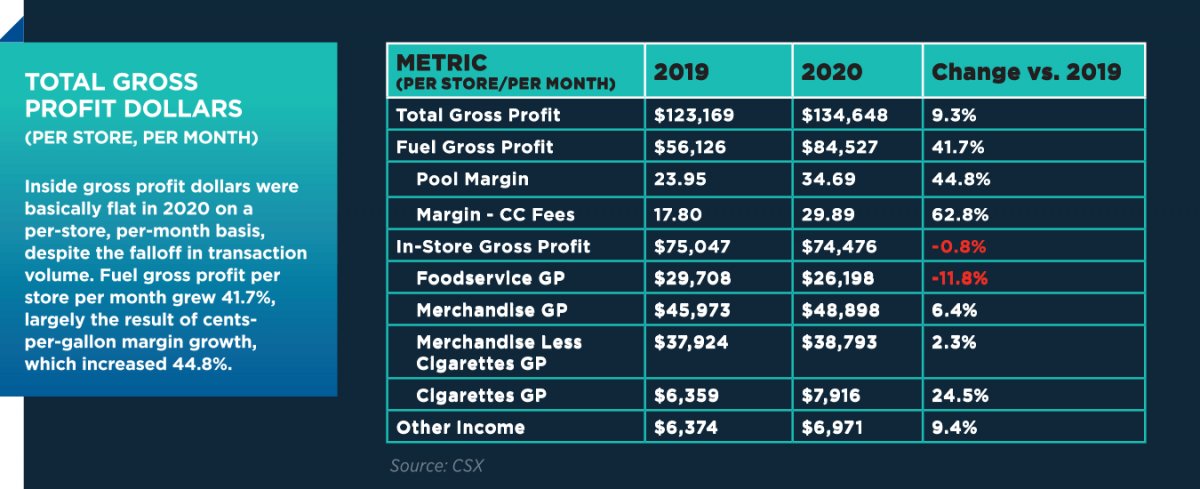
McIlvaine pointed out the volatility in retail fuel pricing throughout 2020. The year ended with an average fuel retail price of $2.17 per gallon, compared with $2.59 in 2019. “Meanwhile, our [cents per gallon margin] was up markedly this year, around 34.7 cents, in the face of significant demand destruction,” he said. Cents-per-gallon (CPG) margins gained more than 30% in 2020 compared with 2019, moving from 26.3 CPG to 34.7 CPG, respectively. That’s a margin increase of 8.4 CPG. “That’s a pretty strong increase,” he added.
Putting the CPG numbers in perspective, McIlvaine noted, “CPG has been on a consistent rise over the last five years. Obviously 2020 had some unique features to it, but generally speaking, CPG has drifted northward, and I think that’s emblematic of the costs of doing business alone, which has contributed to this margin increase.”
“CPG was the savior during the pandemic,” McIlvaine said, noting that fuel retailers gained a nice boost when oil pricing went negative in 2020. Consumers also realized a benefit in lower retail fuel prices, he added.
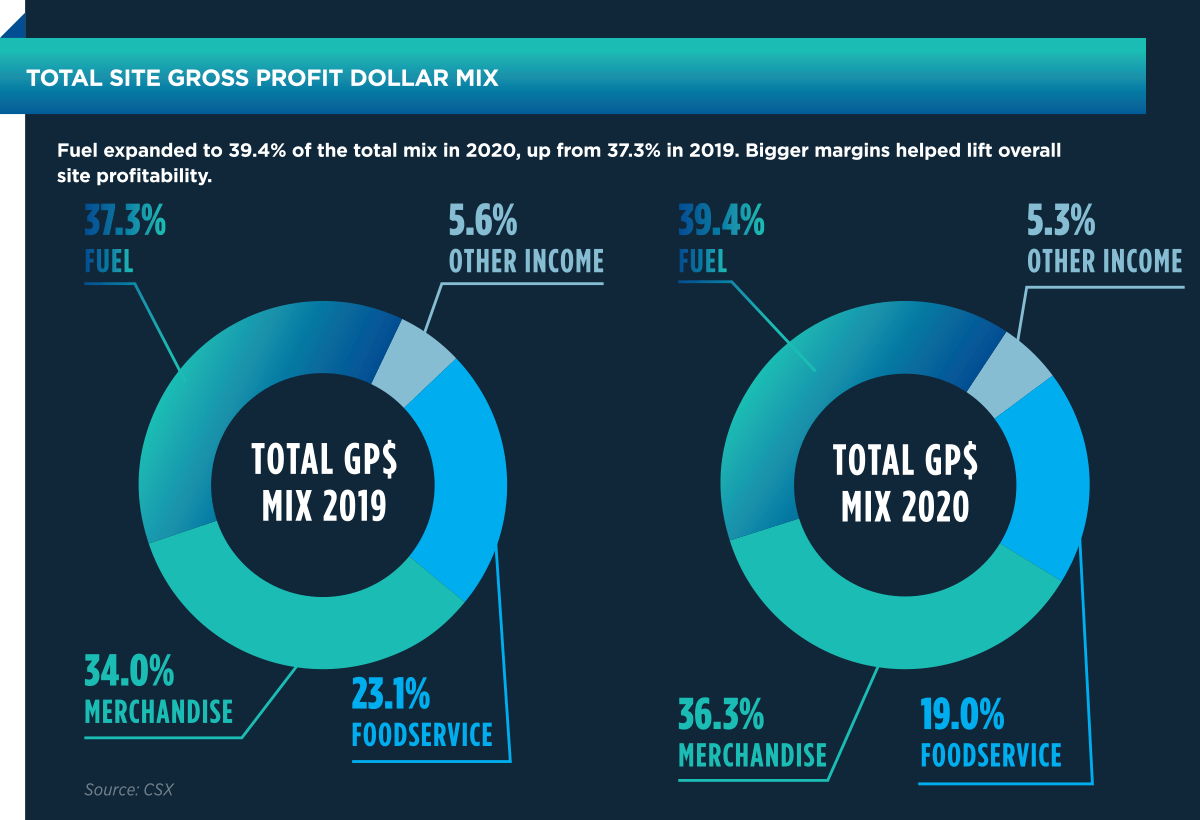
The higher fuel margin in 2020 also contributed to stronger gross profit dollars for fuel in 2020 as a total percent of sales. “The fuel margin made an impact to the mix of overall site profitability,” McIlvaine said. Fuel gross profit dollars increased two percentage points over the prior year and contributed 39.4% as a percent of total gross profit dollar mix, according to NACS SOI data. Merchandise was the next largest contributor with 36.3% of the mix (up two percentage points), followed by foodservice, which dropped to 19% (down four percentage points, largely a result of pandemic-influenced factors). Other income (car wash, ATM, lottery, money orders, etc.) rounded out the total gross profit dollar mix at 5.3% (shy of 5.6% in 2019).
Transactions Shrink, Baskets Swell
I see COVID-19 as an accelerator of further evolution of our industry to continue to own the word ‘convenience.’
Amid the tumultuous year, total convenience industry inside sales managed to increase 1.5% to a record $255.6 billion. “We do think that’s interesting,” McIlvaine said. That meant consumers were still frequenting c-stores to get their daily needs filled.
The bigger sales picture, however, shows total transactions (fuel sales plus inside sales) declined 13.9% for the year. Inside transactions fell 12.9%, while fuel transactions declined 16.1%. The saving grace for c-store operators rested in basket sizes, which increased 18.4% compared with 2019, and in the end made a significant contribution to that 1.5% increase in inside sales. The average basket size was $7.34 in 2020 vs. $6.20 in 2019. “When guests were shopping, they were purchasing more items,” McIlvaine said. “This is what allowed year-over-year sales to be flat to up. So, this signals a modification in consumer behavior. Guests are being intentional with their time and their destinations, and it’s our job as retailers to make them want to choose our stores versus other alternatives.”
In terms of transactions, a rebound is starting to show promise in 2021, McIlvaine said, albeit slowly. “Currently, total transactions remain around 10% or so below the prior year in December 2020,” he said, “and as restrictions ease and vaccines get distributed, it’s not unreasonable to expect that traffic and transactions will rise going forward.”
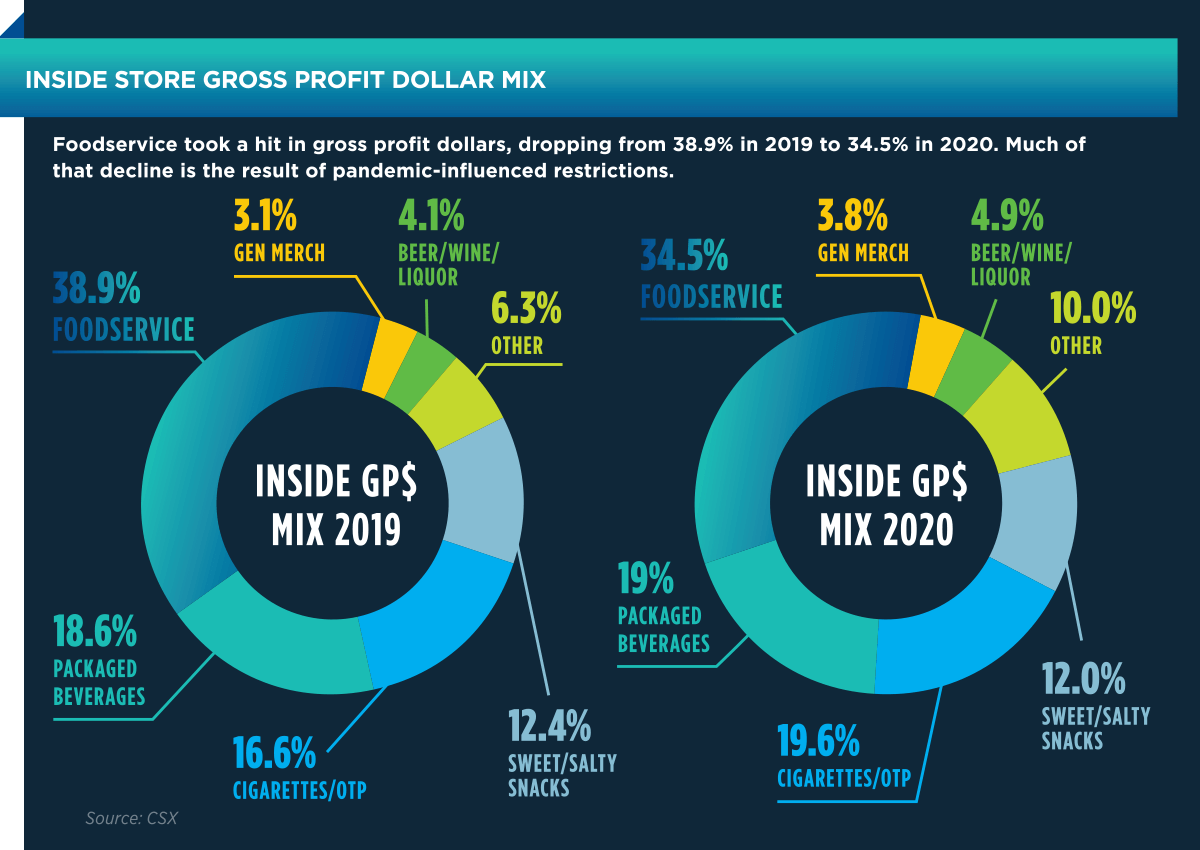
Drilling down on the inside store gross profit dollar mix for 2020, most categories increased their overall contribution. This was the case for five of the seven categories:
- Cigarettes/other tobacco products (up three percentage points to 19.6%)
- Packaged beverages (up 0.4% to 19%)
- Other (up 3.7 percentage points to 10%)
- Beer/wine/liquor (up 0.8 percentage points to 4.9%)
- General merchandise (up 0.7 percentage points to 3.8%)
Unsurprisingly, foodservice saw a significant drop in its contribution to the gross profit dollar mix (down 4.4 percentage points to 34.5%), and salty snacks realized a small dip in gross profit dollar mix contribution (down 0.4 percentage points to 12%). “Foodservice dropped quite a lot,” said Mcllvine, largely because of pandemic restrictions and local protocols.
Consumer behavior between channels in 2020 also showed shifts, with the online segment predicted to have double-digit growth over the five-year period from 2020 to 2025. U.S. channel sales projections from Kantar Consulting forecast a 12.2% compound annual growth rate (CAGR) for online sales between 2020 and 2025, compared with 2.7% CAGR for the convenience channel. The data show the discount channel surpassing convenience with a 4.4% CAGR. “Consumers have really gotten used to buying goods from [the online] channel,” McIlvaine said.
Independents Struggled; More M&A Likely
“The pandemic was very devastating to independent operators,” McIlvaine said, “particularly those that did not sell fuel. Nearly 3,000 independent c-stores went out of business in 2020, according to the NACS/NielsenIQ TDLinx Annual Store Census. More than half of that group—67%—did not sell fuel.
When you have a year like last year, it shows that we are not running away from those categories [fuel and tobacco] but we [TXB] are putting our time and effort into places that the future holds.
Looking at the store count buckets in chain sizes, McIlvaine pointed out a notable shift in store counts for chains in the 11 to 50 store category. That group had about 378 fewer stores in 2020. The number of chains in the 201 to 500 store range also fell, decreasing by 136 stores. Two store count brackets that increased in 2020: chains in the 51 to 200 range and chains with 500 stores or more. Another 400-plus stores now fall into those two segments.
“This may seem a little counterintuitive, but when you consider the M&A activity in 2020 it makes a little more sense,” McIlvaine said. There were several chains that sold in the 11 to 50 size range, he explained, and they were probably acquired by larger chains, resulting in a shift of the overall mix.
One element that remains consistent is that the c-store industry is very fragmented, McIlvaine said. “Compared to other retail industries, convenience has about two-thirds of its total store count operated by small chains or independents,” he said. “Consolidation is likely to continue for the next couple of years.”
Sizing up total c-store closures relative to other retail segments, dollar stores fared better than c-stores in 2020. The c-store total contracted (-1.6%), while the total store count for dollar stores climbed (3.1%). “Dollar stores continue to pose a threat in competing for the convenience customer,” McIlvaine said. Other segments that notably declined at a greater percentage than c-stores include the number of superettes (-13.2%), gas kiosk sites (-9.4%) and smoke shops (-8.4%).
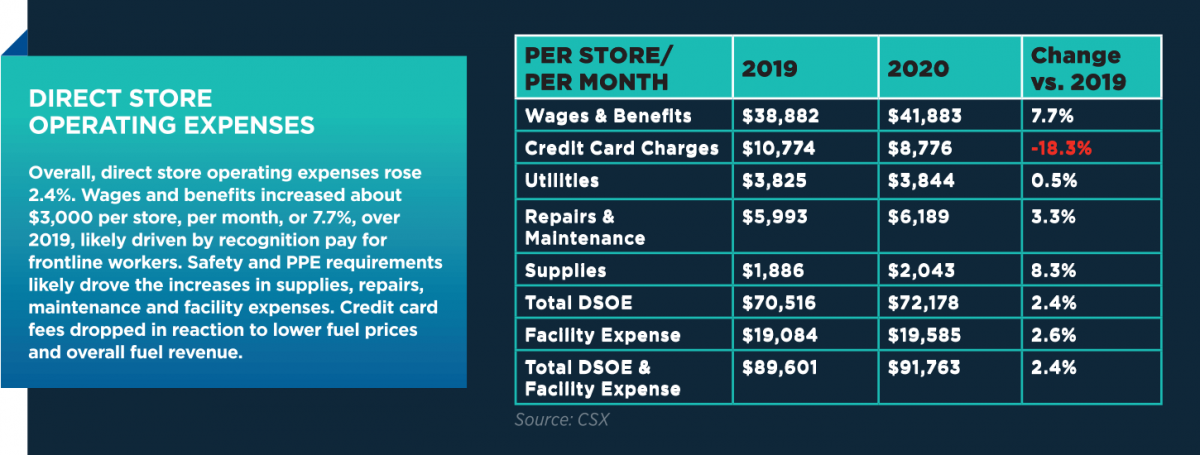
Another callout for convenience operators comes by way of wages and benefits. Wages and benefits increased 7.7% in 2020. Personnel expenses totaled $41,883 per store per month in 2020, compared with $38,882 in 2019. Wages were up 8.3%, an increase of about $2,500 per store per month, to $33,564 per store per month. The change was likely driven by bonuses and higher wages given to frontline workers during the height of the pandemic, McIlvaine said.
Looking ahead, wages and benefits are likely to continue to rise with $15 per hour wage proposals making their way through Congress. “The pandemic, in a way, has given operators a glimpse into what they can expect can happen to inside store profit if sales volumes and mix—namely foodservice—are not prone to offset the changes in the cost of labor,” McIlvaine said.
Long-Term Implications
Two big and largely unanswerable questions surround 2020 year-end data: What will stick? And what will trickle away as things get back to normal?
On the fuel side, the massive increase in margins, which clearly helped offset losses, will probably “never happen again,” said Jared Scheeler, CEO of six-store chain The Hub Convenience Stores Inc., based in Dickinson, North Dakota. He also serves as vice chairman, treasurer, of the NACS Board of Directors. He shared his perspective on how NACS SOI data relates to his long-term planning.
“Consider when the day comes that we don’t have liquid fuel—when electric vehicles rule—how will we replace that? We got a taste of that last year. It affects our pocketbooks more than we anticipated,” Scheeler noted. In his operating area of North Dakota, he said fuel margins leveled off to normal faster than perhaps what happened nationwide. “It would be a grave mistake for anyone to look at the trends in 2020 and say, ‘We made a nice chunk of profit on fuel and cigarettes,’” he said. Notably, while cigarettes showed a growth increase in 2020 data, the category has been declining for the past decade.
In the same vein, SOI data on tobacco and fuels “does not change our business strategy” on either category, said Kevin Smartt, president and CEO of Texas Born (TXB) Stores, a 47-store chain in Spicewood, Texas. He also serves as NACS chairman of the board and vice president of political engagement.
Last year was a bit of an anomaly when it came to both fuel and tobacco—among other things, Smartt said. “When you have a year like last year, it shows that we are not running away from those categories, but we [TXB] are putting our time and effort into places that the future holds. We are still a great source for those products; they are still there.”
With the new TXB brand—the chain is undergoing a rebranding from Kwik Chek—“we are energy agnostic,” Smartt said, noting that new builds include charging stations for electric vehicles.
One other piece Scheeler views a little less favorable for the long-term than the NACS SOI data might suggest is basket size. “The average ticket did go up. We experienced the same thing at The Hub that the NACS data shows,” he said. “If it wasn’t for that, I think a lot more stores in our industry would be in trouble.”
However, Scheeler does not want the basket size bump to cause him to lose sight of the fact that transaction counts went down. “I’d choose frequency any day,” he said, if given the choice between basket size and increasing customer visits. “Frequency gives me the chance to add on the sale each time. The sum of the parts exceeds the whole that the less frequent customer might spend.” He does believe the increase in take-home package size will stick, at least for the short term. “It’s a habit that hasn’t gone away yet.”
From a big picture point of view, Scheeler said the SOI data this year “show us how we need to more quickly evolve. We are quickly coming into another stage of evolution for our industry. I see COVID-19 as an accelerator of further evolution of our industry to continue to own the word ‘convenience.’”
Take a Deeper Dive into the Data
 The NACS State of the Industry Report of 2020 Data—the essential guide for convenience and fuel retailers to benchmark their performance in tumultuous 2020—is now available for purchase in a digital-only format. NACS is now in its 51st year of publishing the report, which highlights business-critical categories of finance, store operations, merchandising and fuel sales. The data are also analyzed and presented in a comparative performance quartile format based on store operating profit, which allows you to benchmark and improve your own retail operations by understanding the drivers of key performance metrics.
Purchase today at www.convenience.org/SOIreport.