It’s impossible to predict what any given customer might do upon entering your store, but new survey data sheds light on the journey of many customers and their in-store habits. With this information, you can more effectively plan for adjacencies or targeted marketing that ties into what your customers want.
It is no surprise that the single most common action bringing consumers to c-stores is a fill-up. Half of all Americans say that buying gas was the main reason for their last visit to a convenience store.
According to national consumer data commissioned by NACS, more than half of all drivers filling up at the pump go inside the store. This figure has mostly held steady over the past decade—regardless of the price at the pump. This year, a record 59% of customers filling up said that they also went inside the store.

Customers who go inside perform roughly two and half in-store “actions” on average (2.58, to be specific). More than nine in ten customers who come into the store perform an action—the most common include paying for gas at the register and buying a drink. However they often perform many other actions, too, such as purchasing a snack, meal, lottery ticket or tobacco or other non-purchase activities such as using the ATM or the bathroom. For example, a customer might perform three actions: Purchase gas (action No. 1), buy a drink (action No. 2) and use the bathroom (action No. 3).
In “Selling Fuel to People in a Bad Mood” in the April 2023 issue, we looked at how consumer sentiment drives purchase behavior at the pump and inside the store. Here, we look at what actions tend to connect with other actions, and how it can all tie together in creating larger baskets.
In our analysis, we segmented the individual actions into three categories: light, medium and heavy market baskets, based on how each action corresponded with larger or smaller baskets. While the lighter market baskets are more common, the heavier market baskets are typically most profitable.
Customers who pay for gas at the register tend, on average, to have 3.10 total actions, which is low. It could be that customers paying for gas tend to be in a hurry and entered the store with just that specific task in mind. Toward the other end of the spectrum, customers who bought a sandwich performed an average of 3.91 actions.
Light Market Baskets
The top three actions overall by frequency are three of the four lightest in terms of driving a basket. The data suggests that while these actions are common, they also are least likely to be part of a larger shopping experience.
Convenience and speed are at the fore when it comes to these light market basket actions. These actions often occur when someone needs or wants to buy something specific.
Paying for gas at the register
(3.10 actions)
45% of customers overall performed this action the last time they were in a c-store.
The single most common in-store activity is paying for gas. It’s not simply those who pay by cash (which is a quarter of all customers who come into the store). There’s a sizable group of customers who pay by plastic and also make other purchases when they come into the store.
The only two actions that these customers were more likely to do than the overall average were buying cigarettes (32% of pay-inside customers buy them) and buying lottery tickets (21% buy them), both actions that require assistance at the register.
Those in the Midwest are most likely to say they paid for gas at the register the last time they were in a c-store (52%).
Bought a drink
(3.22 actions)
43% of customers overall performed this action.
Historically, the liquid most associated with c-stores is gasoline—though for a huge percentage of customers, the most important liquid is coffee, soda or water. Nearly as many customers come inside a c-store to buy a drink as they do to pay for gas. Those who commute on a daily basis are significantly more likely to be drink buyers (53%), as well as people in the Northeast (47%).
Bought lottery tickets
(3.48 actions)
20% of customers overall performed this action.
Buying lotto tickets is a fairly common action for c-store customers, though it doesn’t necessarily connect with other purchases the way that other actions do. There are two actions lottery customer are more likely to perform than average: 20% use the ATM and 16% buy beer/wine.
Customers ages 50 to 64 are the most likely to purchase lottery tickets (30%), and it’s most common in the Northeast region (23%).
Bought a snack
(3.50 actions)
32% of customers overall performed this action.
Hungry people seem to be more thirsty. While drink buyers are more likely than average customers to buy a snack, the data suggests snack buyers are really likely to buy a drink. More than half of all snack purchasers (51%) say they also buy a drink, the highest of any category. This consumer data is supported by NACS Convenience Voices survey data. Drink purchasers are most likely to be ages 18 to 34 (44% buy drinks when in a c-store) and in urban locations (41% of these customers buy drinks).
Medium Market Baskets
Bought cigarettes/vaping product
(3.54 actions)
28% of customers overall performed this action.
By definition, tobacco products require someone come into the store for assistance at the register—and so we see an uptick in other actions performed in the store. Like snack purchasers, those who buy tobacco or vaping products are more likely to also purchase a drink (51%). Tobacco/vape customers also overindex on using the ATM (21% use it) and buying beer/wine (18% also buy beer/wine).Customers ages 35 to 49 years old are the most likely to purchase tobacco/vaping products (40% of this age group).
Used the bathroom
(3.73 actions)
22% of customers overall performed this action.
While bathrooms don’t directly add to sales, they can have a big impact on incremental sales. Customers who come into the store in order to use the bathroom typically perform nearly three other actions. A top action among bathroom users is using the ATM (used by 24% of those who used the bathroom). In addition, those who visit the bathroom are also more likely to purchase a snack (40% do) and buy a sandwich/meal (17% do) than the average customer.
Bought beer/wine
(3.76 actions)
13% of customers overall performed this action.
Beer/wine purchasers fill up a sizable market basket, but there is one item where they significantly underindex: non-alcoholic beverages. Only 28% of beer/wine purchasers (compared to 43% overall) buy a non-alcoholic drink. However, beer/wine purchasers overindex on several actions, especially purchasing cigarettes/vaping products (also purchased by 38% of alcohol purchasers). Beer/wine customers are also more likely to use the ATM (25%), purchase lottery tickets (24%) and buy a sandwich/meal (21%).
In recent years, many stores have seen that beer/wine sales pair well with the sales of sandwiches or meals. For some customers, buying the two together could be part of building one meal, while for others the purchases might be for two different periods: a sandwich for now and beer/wine to relax at the end of the day.
Heavy Market Baskets
We define heavy market baskets as situations when a customer performs 3.90 or more actions. The inherent chicken-or-egg question when it comes to this category is whether the individual action triggered the additional purchases/actions, or if putting together a larger basket triggered the inclusion of this action.
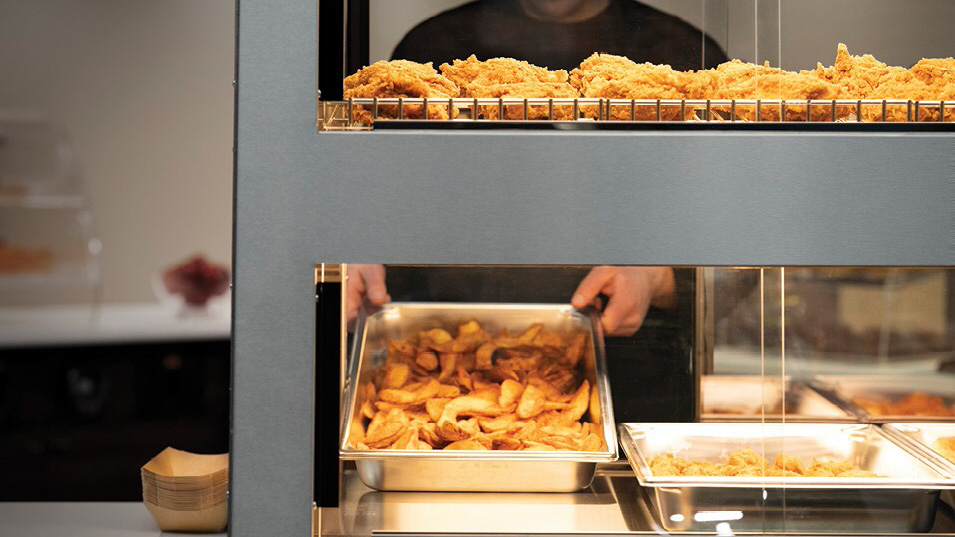
Bought a sandwich/meal
(3.91 actions)
13% of customers overall performed this action.
Foodservice not only provides a higher margin than many other items, it also delivers a larger basket beyond just the sandwich or meal. The data suggests that those who purchase a sandwich or meal are more likely to make a complete meal purchase: 48% also buy a drink, 39% also buy a snack and 21% also buy beer/wine. These customers also are much more likely to stock up on other items, like gum and fill-in groceries (both purchased by 25% of sandwich/meal purchasers).
Used the ATM
(3.94 actions)
17% of customers overall performed this action.
Those who use the ATM are much more likely to perform additional actions. Perhaps flush with cash, there are a multitude of in-store actions these customers are more likely than the average customer to perform, including paying for gas inside (47%), buying a drink (39%), buying a snack (39%), buying cigarettes (36%) and even using the bathroom (31%).
While the presumption is that cash is king among older customers, those ages 18 to 34 are significantly more likely to use the ATM than older people (22% of those ages 18 to 34 versus 5% of those 65+ reported using an ATM the last time they were inside a c-store).
Bought fill-in groceries
(3.95 actions)
12% of customers overall performed this action.
Customers shopping for fill-in groceries (for example, milk, bread, eggs) are likely to build a larger market basket. This makes logical sense, since this shopping experience take more time than quickly grabbing a candy bar from below the register or a drink from the cooler. Fill-in grocery customers are much more likely to use the bathroom (32%), use the ATM (29%) and buy a sandwich/meal (28%).
Customers in urban locations lead the way in purchasing fill-in groceries, with 18% of these customers saying they purchased fill-in groceries the last time they were in a c-store.
Bought gum/mints
(4.27 actions)
10% of customers overall performed this action.
The most interesting finding relates to those who buy gum and mints. It is not a particularly common action—just one in ten customers purchased gum or mints on their last visit. However, those people who purchase gum/mints typically have the highest number of other actions. It’s probably the effect rather than the cause. More often than not, these items probably represent a final impulse purchase by those checking out at the register with other items.
Want More Information?
NACS has more survey data at its Fuels Resource Center (www.convenience.org/fuels). Also, the NACS Convenience Matters podcast episode “Survey Reveals What Drives the Most Purchases” includes more insights. Find all Convenience Matters episodes at conveniencematters.com.