“Which retailer is the strongest—or most profitable—when it comes to fuel?”
That’s by far the most common question that OPIS hears every year. So, naturally, the company’s analytics team set out to define who were the strongest fuel retailers—and more importantly, why certain chains were stronger than others. OPIS developed an annual scorecard that provided answers and shared some of the results and commentary with NACS.
There are a lot of paths to success to become a top 50 retailer: Some are ultra competitive on price while others are not; some are companies with thousands of locations while others have just a few dozen; and some are well-known foodservice-first brands while others are well-known fuel brands. If there is one commonality, it’s that each of the top 50 companies has defined what they want to be known for and they lean into it.
With fuel gallons continuing to decline each year, this analysis of the most efficient fuel retailers in 2025 provides more than a listing of the best of the best; it’s a blueprint that companies can study to see how they can compete—or even thrive—in an incredibly competitive, dynamic marketplace.
How the Rankings Are Determined
Each year, OPIS provides NACS with a ranking of top fuel sellers using a comprehensive scorecard based on what OPIS knows about each company, including:
- An estimate of the gross profit on a gallon of gas, calculated using OPIS’s standard rack-to-retail margin methodology
- Location data from a third-party provider that tracks the number of times a device has visited a convenience store
- Monthly taxable gallon information reported on a state level by government entities
- A localized comparison of sites to others within a one-mile radius, which helps calculate a head-to-head “winning percentage”
- Demographic information to indicate which chains are in areas with the highest or lowest property values and household income, plus store density
Rankings for the OPIS Top 250 Retail Power Brands Report take into account weighted data based on what industry insiders say are the most important metrics. This article includes a small percentage of the rankings and analysis OPIS provides. If you’re interested in the full report, contact Brian Norris, executive director of retail fuels at OPIS, at [email protected].
Note that for comparative differentials on prices, decimal places have been truncated and numbers rounded for readability compared to the data provided by OPIS.
Price Is Nice—but it’s not Everything
According to NACS consumer survey data, fueling is the top reason that people say that they go to convenience stores (44%), and the top reason they have a preferred store or brand is because “it usually has lower prices.” But other factors also resonate with consumers. Half (50%) say that quality fuel is important and 41% say that a loyalty program is something that they seek out.
That means that there are several ways that fuel retailers can boost their traffic, and that comes through in rankings looking at price differentials within the top 50 most efficient fuel retailers.
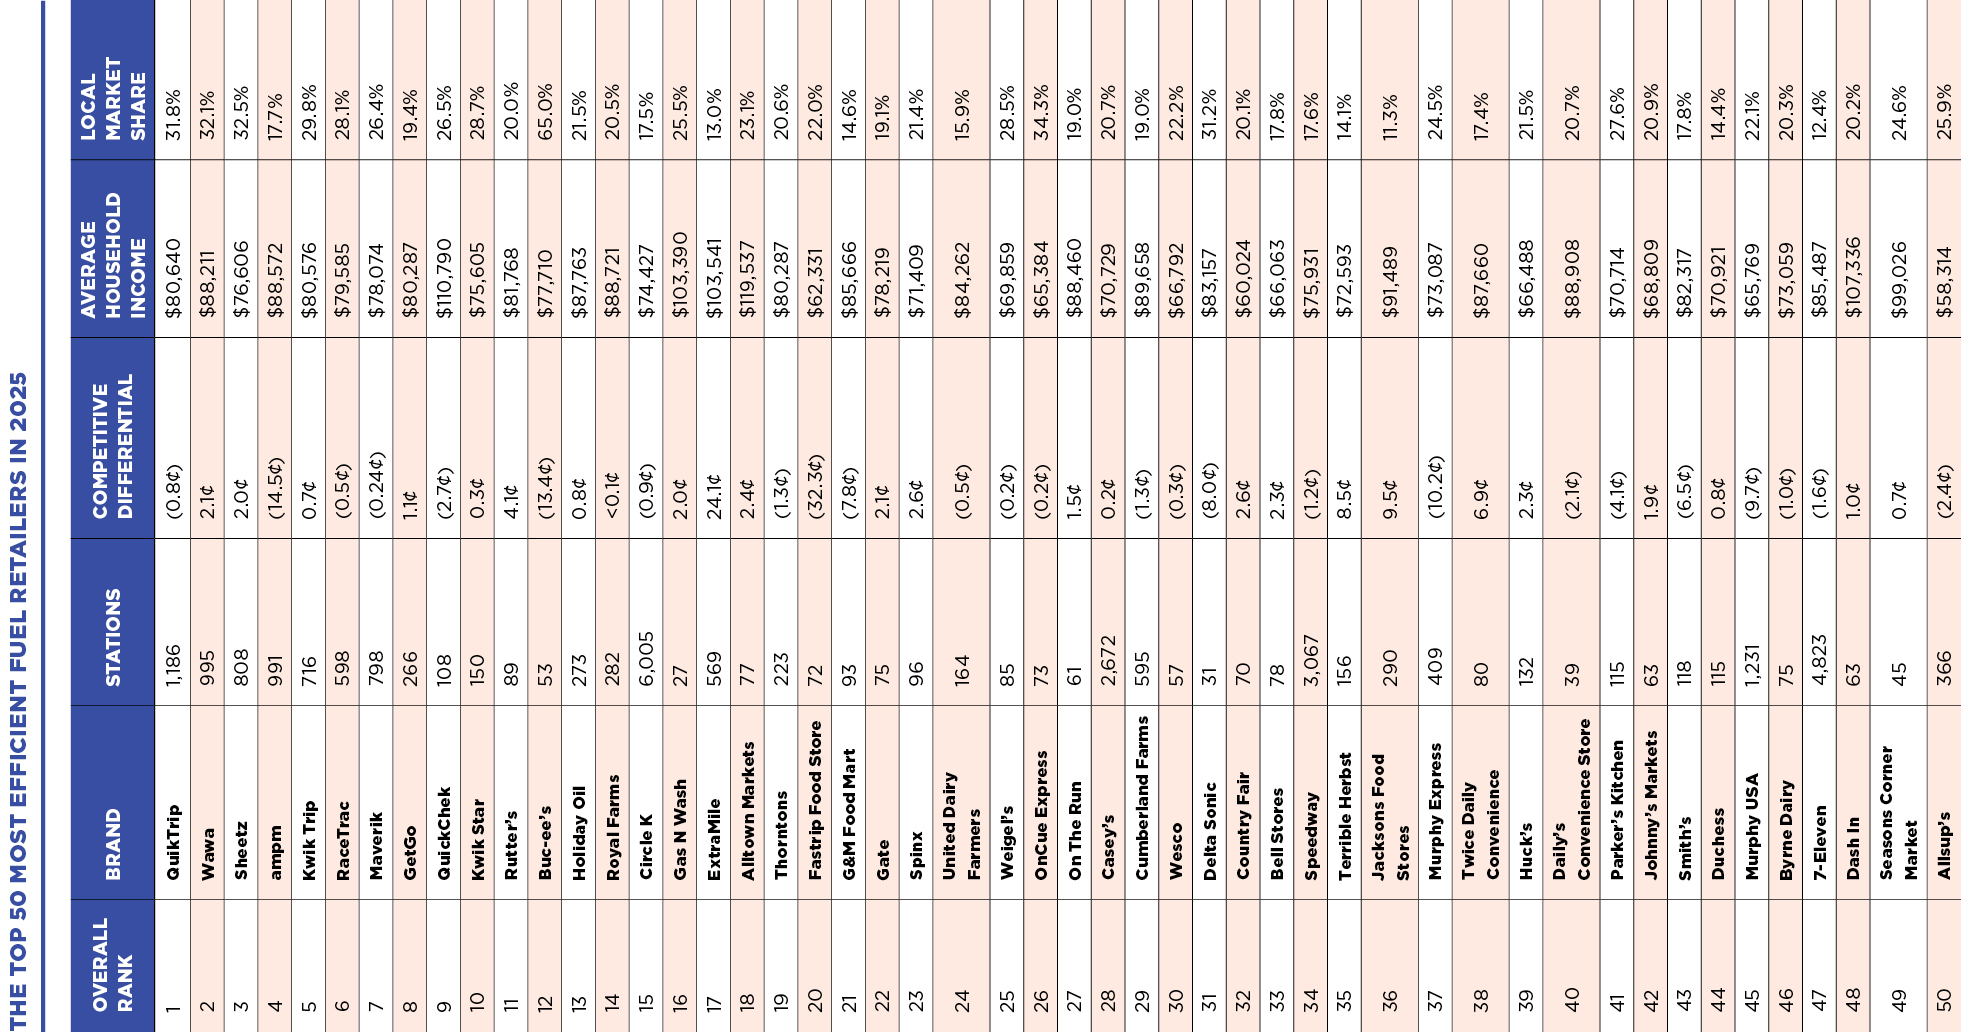
Pricing is clearly one of several factors that drive sales for the top 50 most efficient fuels retailers—but not the only one. Of the top 50, 25 have lower prices than competitors in their market, while 24 have higher prices. (One retailer, Royal Farms, has a competitive differential of less than 0.1 cent, putting it spot on with its competitors.) Taken together, the top 50 have prices that average 0.5 cents below the pricing of their competitors.
Most of the top 50 retailers have prices that range from about 2 cents per gallon less than their competitors to about 2 cents per gallon more than their competitors. However, there are some interesting outliers.
Among the top 10 retailers with the lowest relative prices, several strong fuel-first brands populate the list, while retailers with higher prices compared to their competitors may be more known for their overall store offer than their fuel.
Price May Matter More in 2026
In 2025, there was very little price volatility—only a 67-cent difference between the year’s low and high price. That meant that gas prices weren’t as top of mind as in some other years with greater volatility. That certainly has not been the case over the first half of 2026; at the end of May 2026, gas prices were approximately $1.70 higher than they were at the beginning of the year.
Fuel prices are much more top of mind with consumers, and that means that they are more likely to drive five minutes out of their way—or more—to find the best deal on fuel. But that may not hold true everywhere. Demographics also play a role, and price increases will change consumer behavior based on how much price increases affect their overall financial situation.
“In more affluent areas, a 20-cent price increase is not really affecting your monthly budget, but that can have a huge impact in areas where the median income is much lower,” said Brian Norris, executive director of OPIS retail data and project management.
Not surprisingly, in higher-income areas retailers are more known for their robust in-store offers or carwashes than for being a price leader. Meanwhile, in less affluent markets, retailers are much more competitive on price.
National Leaders and Local Leaders
The most efficient companies are also the ones most able to grow their store count—and market share. Ten of the top 50 most efficient fuel companies have at least a 1.1% national market share. Cumulatively, the top 10 command a 26.1% share of the national market.
Meanwhile, while looking at the local level, 10 companies have at least a 28% market share. The strong national brands generally have fuel prices that are slightly lower than their competitors’ prices—and for those that don’t, they are well-known for their food offers.
Brands with the highest local market share are also seen as having lower prices than their competitors. Perhaps unsurprisingly, there is a lot of overlap between these two segments—half of the top 10 for local market share is comprises strong national brands with large market shares.
Head-to-Head Efficiency
Taking together all the components of a store’s offer, including price, OPIS measures the percentage of times that a retailer was more efficient in gaining market share in direct competition with other brands in their markets.
“I think head-to-head winning percentage is a great metric, because it doesn’t just tell you the percentage of times you win against your competitors, it speaks to how powerful a brand is in the community,” said Norris from OPIS.
Brands that expand into new markets often see a decline in head-to-head efficiency, noted Norris, because it often takes time to build up brand recognition in a new market—outside of Buc-ee’s, of course.
What It All Means
It only takes a few minutes of watching any news broadcast to see a story about oil or gas prices. They clearly matter to consumers. But that doesn’t mean that the only strategy to win customers is to be a low-price leader.
In looking at the top five fuel efficiency leaders from 2025, four of them are not considered “discounters.” Their offers go beyond fuel and are very identifiable to the communities in which they do business.
Whether or not they are companies that have a few dozen stores or a few thousand, they have one thing in common: They started small and grew because they had a formula that worked and also resonated with customers.
“They are at the top because of the way that their customers perceive them in their markets,” said Norris. “Customers know that they’re getting a fair deal on fuel, but they also know that it’s a nice clean store with a lot of different food options, a clean bathroom and friendly staff who people get to know over time.”
.jpg?language=en-US)