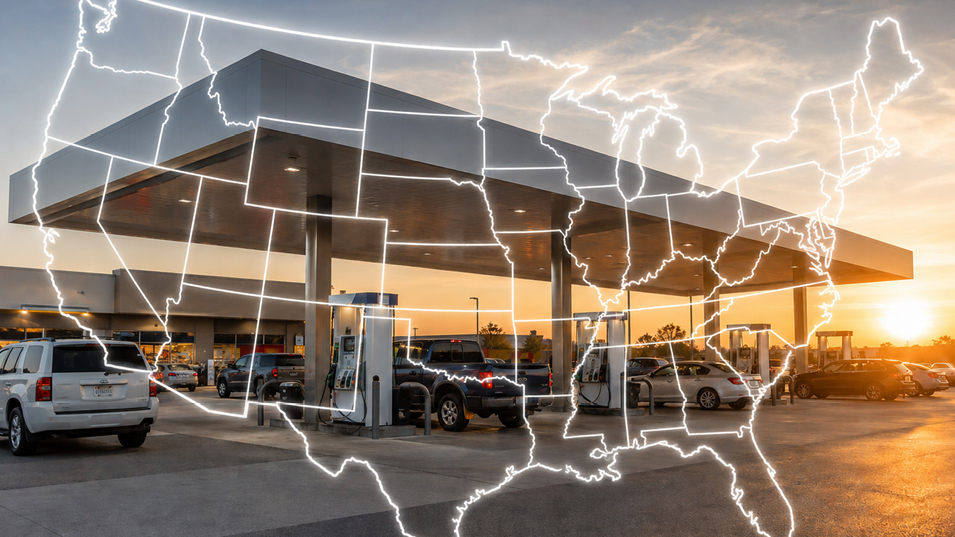
As part of its State of the Industry reporting, NACS separates the United States into six regions, which are loosely based on the U.S. government’s Petroleum Administration for Defense Districts, or PADDs.
The regional location of a store has an enormous impact on performance—some regions are stronger on foodservice, and a store without a robust offer may be perceived as falling behind; in other regions, fuel remains a much more important part of the mix. Operating costs, including wages and benefits, also vary widely by region. Breaking down national data into the six regions gives operators an opportunity to spot trends and gain insights that are most relevant to them while also gaining a better understanding of operational models in other locations.
Region 1: Northeast
Region 1, the Northeast, is typically home to strong sales and store performance where gross profit is close to evenly distributed between fuels, merchandise and foodservice. That pattern carried into 2025.
The number of inside transactions was 22.3% higher than the national average, and inside sales per store, per month—$429,284—was 70.9% higher than the national average.
From a year-over-year perspective, Region 1 saw slower growth than the national average. Total fuel sales per store, per month fell 9.3%, compared to the national average of a 5.4% decline; inside sales per store, per month fell 2.5%, compared to 1.7% growth nationally.
A bright spot: Compared to sales figures, gross profit suffered less of a decline, dipping 1.9% overall and 1.5% in terms of in-store results.
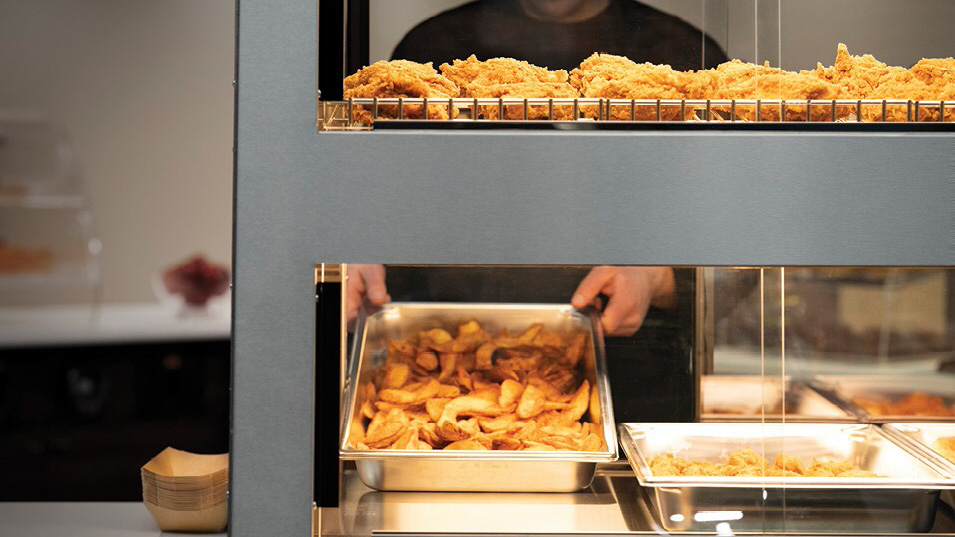
The Northeast traditionally leads the industry when it comes to gross profit, particularly in foodservice. Even in a down year, in-store gross profit was 84.3% higher than the national average in 2025 while gross profit from foodservice was 134.7% higher.
Mirroring national trends, turnover continued to improve. At 86.9%, non-manager turnover was 28.4 points lower than the national average, and fell 5.6 points from 2024. Manager turnover rose 2.6 percentage points to 26.8%, but remained below the national average.
While direct store operating expenses (DSOE) are higher in Region 1 than the rest of the country, they remained stable year over year despite rising utility costs. In 2025, the average DSOE per store, per month was $159,061, just barely higher than the 2024 average of $159,023.

Region 2: Southeast
Region 2, the Southeast, is known for being strong in fuel sales. In 2025, the region’s operators sold 18.4% more gallons than the national average (186,536 per store, per month), a figure that ticked up 0.2% year over year.
Total transactions fell 4.3% year over year, with inside transactions dipping 3.8%. Of the top 10 in-store merchandise categories, only packaged beverages, OTP, and candy avoided year-over-year sales declines. Beer, salty snacks and packaged sweet snacks all saw sales declines of more than 5%.
Despite the challenges, in-store gross profit rose slightly (2.5%), buoyed by a 5.3% increase in gross profit from foodservice. Overall, total gross profit was $153,581 per store, per month, 9.1% less than the national average.
From 2024 to 2025, the prepared food category grew sales by 6.0% in Region 2, with gross profit from prepared food growing 8.2%. Cold dispensed beverage sales rose 7.1%, with gross profit from the category jumping 12.7%
Turnover in Region 2 has long been higher than the national average, and the news in 2025 was mixed. Non-manager turnover fell from 152.8% to 141.6%, while manager turnover increased from 39.9% to 42.2%.

Region 3: Midwest
Region 3, the Midwest, typically closely mirrors national averages. In 2025 that continued, but with slightly rosier outcomes than the rest of the country.
Inside store operating profit improved from -$244 to $2,543 on a per store, per month basis. Bucking national trends, total transactions increased, inching up 0.6%, driven by a 5.2% increase in inside transactions. Removing cigarettes from the mix, merchandise sales grew a healthy 4.8% to $148,039 per store, per month. That total is 9.5% higher than the national average.
The backbar outperformed national averages, with cigarettes sales falling 2.4%, compared to a national decline of 5.2%, and OTP sales grew 10.1%, compared to national sales growth of 8.4%.
The positive year for Region 3 resulted in a 10-cent turnaround in inside operating profit per transaction, as the region moved from -4 cents per transaction to a 6-cent profit.
The average basket in Region 3 fell slightly on the year, from $9.05 to $8.84. That average basket size was $1.15 more than the national average, reflecting the region’s higher percentage of trips that involve fill-in groceries—like milk.
The region, which historically has low turnover, continued to improve in that area. Non-manager turnover fell 4.0 points to 103.7%, while manager turnover fell 1.2 points to 23.2%.

Region 4: South Central
Region 4, South Central, is the site of c-store growth. Texas, home to most of the region’s population, added 88 stores to its count according to the 2025 NACS/TD Linx store count. With 16,504 sites, it has a store for every 2,000 people, making the region unusually dense.
With strong projections for continued population growth in the region, it makes sense that operators are building now. In the short term, the region’s performance in 2025 showed a strong reliance on fuel. Fuel accounted for 70.5% of the region’s sales, compared to 64.6% nationally, and 41.4% of the region’s gross profit, compared to 38.5% nationally.
Inside transactions were below the national average by 24.4% and also fell 9.4% year over year. Basket size increased 70 cents to $6.81, but still lagged the national average.
Total, sales were $549,330 per store, per month, 23.4% below the national average. Expenses, however, were also low, with a total direct store operating expense (DSOE) of $68,657, 27.1% below the national average.
Operators in the region kept DSOE in check, with the figure just 2.1% higher than a year ago.
Another bright spot was turnover. Non-manager turnover fell 17.2 points to 114.1% while manager turnover fell 5.2 points to 28.9%.
Region 4’s foodservice mix is traditionally high on commissary (about double the national average) and low on prepared food. For the year, commissary sales increased 1.0% while prepared food sales dipped 0.3%.

Region 5: Central
To start with the bad news: Pump transactions in Region 5 declined 12.6% year over year, and fuel sales were 26.7% below the national average.
However, inside transactions were up 13.6% in Region 5 year over year as national inside transactions declined 1.6% year over year, a noteworthy accomplishment. That transaction growth saw foodservice sales increase 4.4% and inside merchandise sales grow 3.1%. Removing cigarettes from the mix, inside merchandise sales grew 4.8%. Top perfomers included packaged beverages, OTP, candy and alternative snacks, which all saw year-over-year growth of at least 7.4%.
The region continued to have lower direct store operating expenses (DSOE) than the national average. The region’s per store, per month DSOE of $71,982 was 23.6% lower than the national figure of $94,179, despite 5.1% growth on the year.
Lower direct store operating expenses (DSOE) led to baskets in Region 5 being more profitable than the national average. The inside operating profit per transaction was 14 cents, higher than the national average of -7 cents per transaction.
Region 5 benefits from low turnover—98.9% for non-managers and 24.8% for managers. Those numbers showed little change year over year, with non-manager turnover up 0.3 points and manager turnover down 1.1 points.

Region 6: West
Region 6, the West, remains an outlier compared to the rest of the nation. Due to its smaller store sizes and foodservice programs that aren’t as developed as those in the rest of the country, the region is more dependent on fuels than the rest of the country, with fuels accounting for 80.9% of sales.
However, stores in the West continue to evolve. Foodservice sales were up 11.8% to $35,811 per store, per month, while inside sales grew to a total of $202,681 per store, per month, a 6.5% increase despite a 1.8% dip in inside transactions.
When it comes to foodservice, Region 6 is a matter of perspective. Sales are about half the national average ($35,811 per store, per month in the region compared to $72,061 nationally) but growth is strong.
While foodservice growth was strong, the opportunity remains large. Foodservice leakage—defined as the percentage of people at a convenience store who plan to visit a QSR within 30 minutes—was 41.3%, outpacing the national average of 33.3%.
Operators in Region 6 face a high minimum wage and high overall operating expenses relative to store size. However, 2025 saw inside gross profit grow 12.7%, outpacing the growth of direct store operating expenses, which grew 6.3%.