No in-store category was harder hit in 2020 than foodservice, with dispensed beverages—particularly hot dispensed beverages—bearing the brunt of the pandemic’s impact as c-store regulars didn’t stop by for their morning cup of coffee, and government ordinances forced closures or modifications of c-store food and self-serve beverage operations. That’s not to mention consumer wariness about sanitation and food safety.
“Day by day, hour by hour, we were trying to manage what was happening in our stores and satisfy not only compliance but consumer expectations,” said Heather Davis, director of foodservice, Parker’s, based in Savannah, Georgia. With schools and offices shuttered starting in March 2020, commuting patterns were upended, and dayparts compressed. The key morning rush was hardest hit, while the midday and evening dayparts picked up some trips.
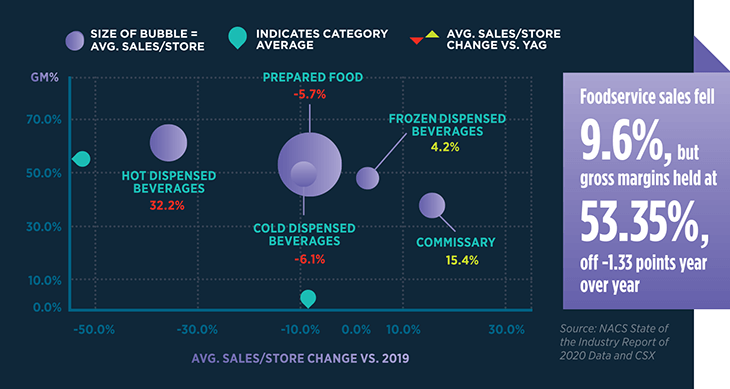
On an annual per store basis, foodservice sales fell 9.6%, from $651,934 in 2019 to $589,241 in 2020, and represented 9.0% of total sales in 2020, NACS State of the Industry data show. Foodservice gross profits represented 19.5% of total store gross profits, dropping 11.8% year over year from $356,496 in 2019 to $314,377 in 2020. Gross margin dipped to 53.35% in 2020, a decline of 1.33 points compared with 2019.
Foodservice remained a crucial contributor to store trips, accounting for 22.9% of inside sales in 2020. Foodservice represented 35.2% of inside gross profits, a drop of 11.8 points year over year. Despite the challenging year, the category still delivered a significant portion of overall inside sales and gross profits.
The foodservice segment of in-store sales includes the five categories of prepared food, commissary, hot dispensed beverages, cold dispensed beverages and frozen dispensed beverages.
Prepared Food
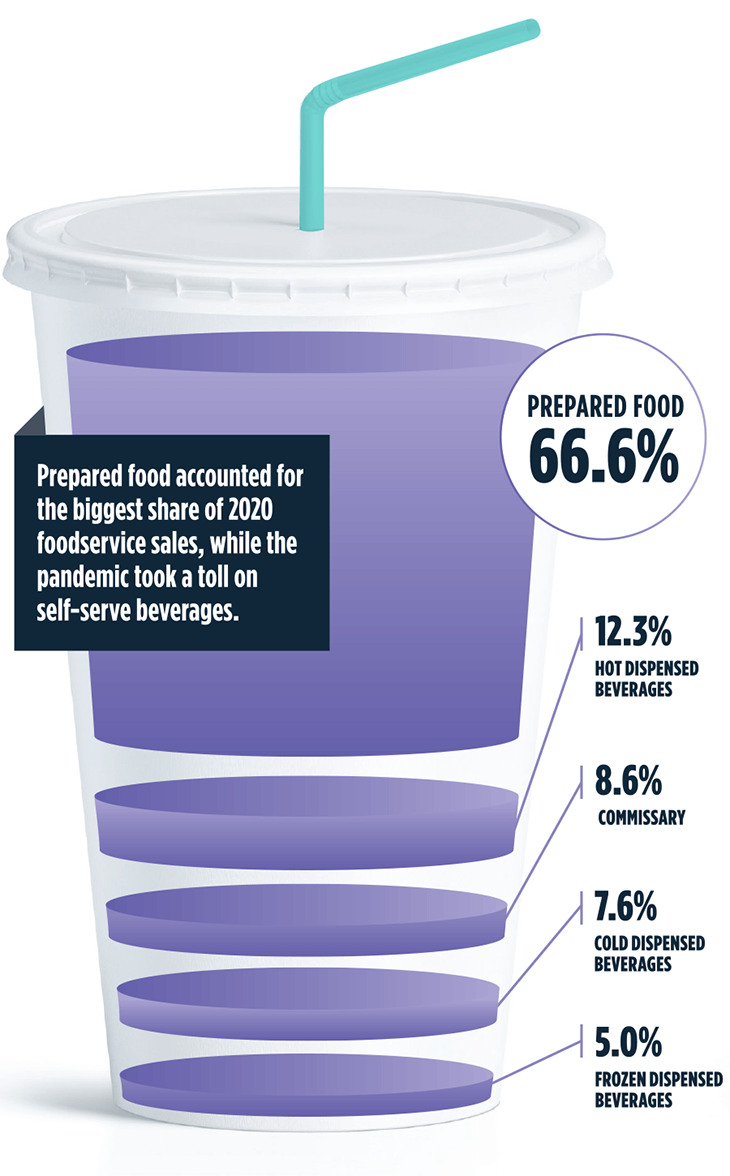
Prepared food contributed the biggest share of 2020 foodservice sales at 66.6% of sales, an increase in share of 1.8 points compared with 2019. After an initial dive, prepared food gathered speed in the third quarter as consumer trust returned regarding store-made food items and states reopened. For the year, prepared food saw average annual sales per store fall 5.7% to $462,801.
Gross profit dollars from prepared food totaled $249,105 in 2020, an 8.0% decline compared with 2019. The gross margin percentage for prepared food stood at an average of 53.83%, a fall of 1.38 points year over year.
“Prepared food business declined because consumers weren’t out and about,” Davis said. “As the pandemic continued and restaurants remained closed or were operating at reduced capacity, customers tried food from convenience stores for the first time—or the first time in a long time,” she said.
Commissary
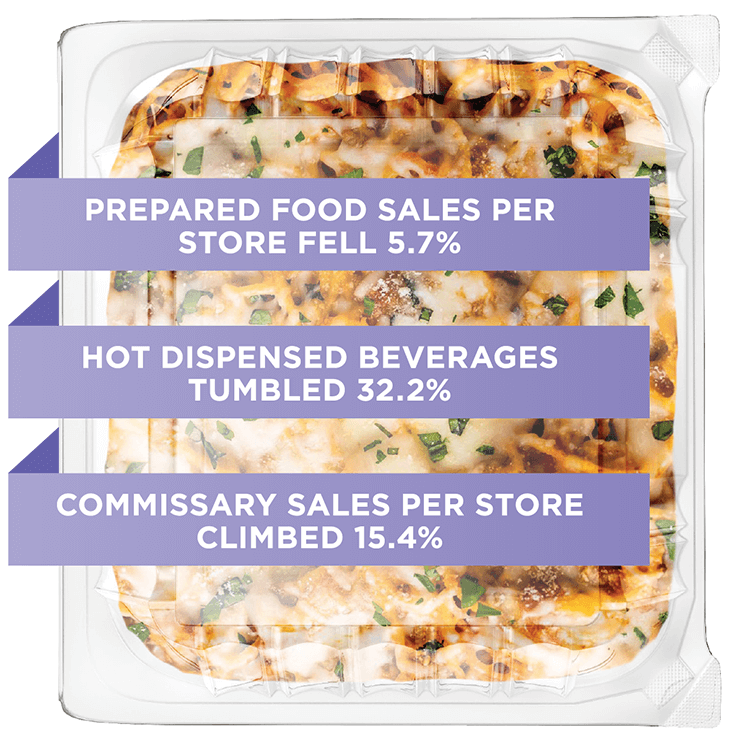
Commissary was the bright spot in an otherwise challenging year for foodservice. The subcategory includes sandwiches and wraps, sides and salads, heat-and-eat foods like burritos and ready-to-eat meals like soup. Commissary traditionally contributes the smallest percent of sales within foodservice but in 2020 accounted for 8.6% of sales. For the year, commissary sales per store climbed 15.4% to $59,565. Gross profit dollars rose 17.4% to $20,511, and gross margin percentage edged up 0.58 points to 34.43%.
“There was some built-in confidence with prepackaged items at the onset of the pandemic, so people bought more prepackaged than normal. They felt like these items were safe; they weren’t handled a lot,” Davis said.
Hot dispensed beverages
Hot dispensed beverages accounted for 12.3% of foodservice sales in 2020, making it the second-biggest contributor behind prepared food. Hot dispensed beverages experienced the biggest decline in sales among foodservice categories, tumbling 32.2% from 2019 levels and accounting for $85,166 in annual sales on a per store basis. Gross profit dollars fell 34.4% in 2020 to $55,477. Gross margins fell 2.18 points compared with 2019 but still contributed the highest margin percentage among foodservice categories at 65.14%.
Coffee still accounted for the bulk of hot dispensed beverage sales at 48.8%. Coffee sales on
a per store annual basis fell 35.8% to $41,552 year over year. Gross profits declined to $25,102, while gross margin percentage was 1.09 points lower than 2019 at 60.41%.
Cappuccino and specialty coffee represented the second largest percentage of hot dispensed beverage sales at 38.4%. Cappuccino and specialty coffee sales declined to $32,708, and gross profits fell 40.3% year over year to $23,819. The gross margin of 72.82% for cappuccino and specialty coffee was the highest among the hot dispensed beverage subcategories.
Cold Dispensed Beverages
Cold dispensed beverages accounted for 7.6% of foodservice sales and $52,675 in average sales per store in 2020, down 6.1% from 2019. The category saw gross profit dollars fall 4.1% to $25,622 on a per store basis. Gross margin improved by 1.03 points to 48.64%.
Carbonated fountain drinks suffered due to closures of dispensers. Although the subcategory still represents the largest percentage of cold dispensed beverage sales, its sales contribution declined from 56% to 41% of cold dispensed beverage sales. Carbonated fountain drink sales decreased by 31.4% to $21,581 on a per store basis. Gross profit dollars fell 32.8% to $9,707, and gross margin slipped 0.94 points to 44.98%.
Other cold dispensed beverages, a subcategory that includes iced coffee, iced specialty coffee and kombucha, accounted for 36.9% of category sales in 2020, up from 21.3% in 2019. Other cold dispensed beverage sales totaled $19,463 in 2020, up 62.9% from 2019. Gross profit dollars grew 61.4% to $10,191. Gross margin declined 0.51 points to 52.36%.
Frozen dispensed beverages
Frozen dispensed beverages, the smallest category in foodservice, finished in the black for the year, notching an increase in average sales per store of 4.2% year over year to $34,464. Frozen dispensed beverages contributed a 5.0% share of foodservice sales in 2020, up from 4.4% in 2019. Gross profit dollars increased 6.5% year over year to $22,382. Gross margin improved by 1.42 points to 64.94%.
Frozen non-carbonated beverages continued to account for the bulk of frozen dispensed beverage sales, increasing from 80.2% to 84.8% of sales in 2020. Average sales per store climbed 10.2% to $29,230. Gross profit dollars improved 12.8% to $19,423. Gross margin percentage of 66.45% increased by 1.51 points and was the second highest among all foodservice categories.